

By Ankit Agrawal & Harsh Punwani
Where AI is paying off in clinical trials, with a spotlight on two use cases
Clinical trials collect more data than ever, yet the answers teams need still arrive late. This paper maps the AI use cases taking shape across the trial, then puts two in the spotlight, study monitoring and content generation, and shows how to do each one well.
A familiar Monday
"We'll get back to you"
It is Monday morning. The study team is on its weekly call, and the clinical lead asks the question she asks every week: are we on track for last patient in?
Everyone on the call holds a piece of the answer. Enrollment sits in the trial management system, screening in data capture, randomization in a third system and site payments in finance. Nobody holds the whole picture. So the reply is the one every study team knows: we'll get back to you.
Two weeks of exports and spreadsheets later, the answer lands. The trial is 105 patients behind plan and heading for a seven-month slip. Six of its 50 sites have not enrolled a single patient.
One of those six sites is the nearest one to a woman with advanced lung cancer. This month she asked her oncologist whether there was a trial she could join.
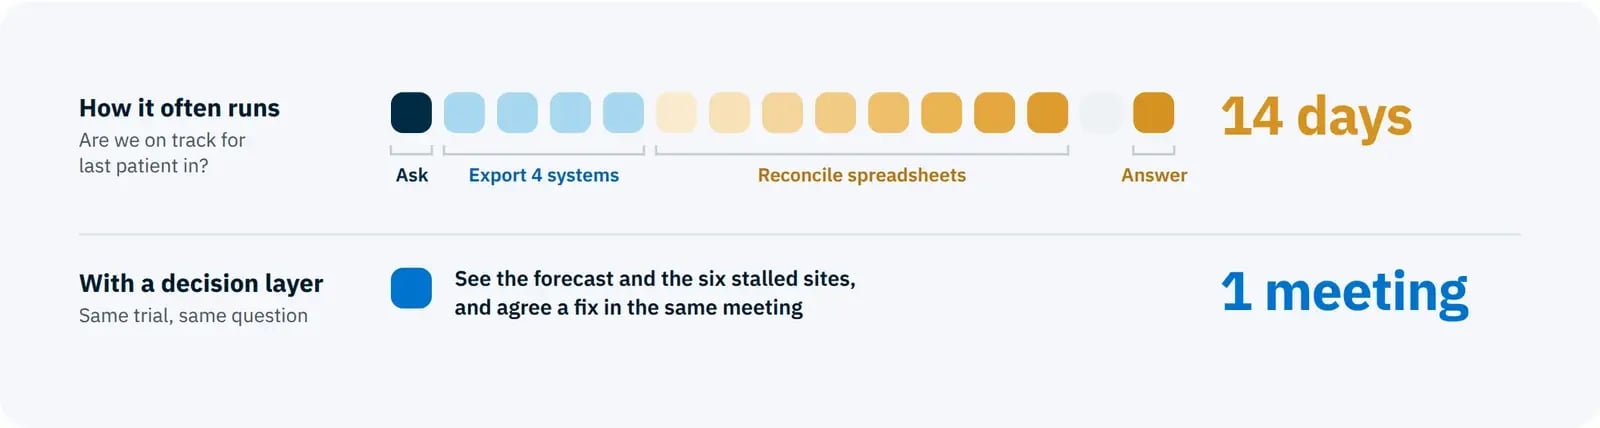
Illustrative scenario drawn from patterns Lynx Analytics sees across study teams. Trial figures match the screen shown in Exhibit 4.
The patient and the study team are waiting on the same thing: a decision about that site. Every number needed to make it already existed. It took 14 days to bring them together. This paper is about closing that gap. It maps where AI is paying off across the trial, then puts two use cases in the spotlight, study monitoring and content generation, and shows how to do each one well.
REAL-WORLD EXAMPLE
The FDA is testing trials that report as they run
In April 2026 the US Food and Drug Administration announced two proof-of-concept real-time clinical trials. The reasons it gave describe the same gap between data and decision, seen from the regulator's side.
Today: Sites report data → Sponsor analyzes → Sponsor submits to FDA. Key signals "can take years"
Real-time trial: Trial reports data signals → FDA views them as the trial progresses. Signals "in real time"
The gap, in the FDA's words
- Data moves in a relay
"Data is typically reported from sites to sponsors, who analyze and subsequently submit data to the FDA." - Signals arrive late
The agency's Commissioner at the time said key data signals "can take years to reach the FDA." - Programs pause between phases
Between phases, "there is generally a hiatus in the development program after one phase ends and the next begins."
What it is testing
- Two proof-of-concept trials
AstraZeneca's Phase 2 TRAVERSE trial in mantle cell lymphoma and Amgen's Phase 1b STREAM-SCLC trial in limited-stage small cell lung cancer. - Signals shared while the trial runs
FDA scientists "can view safety signals and endpoints in real time as a trial progresses." - An early result
The FDA said it had received and validated signals from the AstraZeneca trial, and it proposed a wider pilot program.
Our view. When a regulator expects to see signals while a trial runs, the sponsor needs to see them first. That depends on trial data meeting in one place.
Source: FDA news release, April 28, 2026. A UK government-commissioned review of commercial clinical trials described a similar gap in 2023: no "consolidated real-time view" of trial activity across sites, with industry "selecting sites in the dark."
THE DECISION GAP
Trials are rich in data and short on decisions
The data to run faster trials already exists. It arrives late at the point of decision, stitched together by hand.
Clinical development is a game of long odds played against the clock.
- A program entering Phase I has about an 8 in 100 chance of reaching approval.
- Phase II is the steepest drop: only 28.9% of programs move on to Phase III.
BIO, Informa Pharma Intelligence and QLS Advisors, Clinical Development Success Rates and Contributing Factors 2011-2020 (2021). A 2024 Citeline analysis of 2014 to 2023 data puts the likelihood of approval from Phase I lower, at 6.7%.
The raw material for better decisions is plentiful. An average Phase III protocol now collects 5.9 million data points, and nearly a third of the procedures and data points are classed as non-core or non-essential. That data sits in data capture, trial management, randomization, document, safety and finance systems that rarely meet in one view.
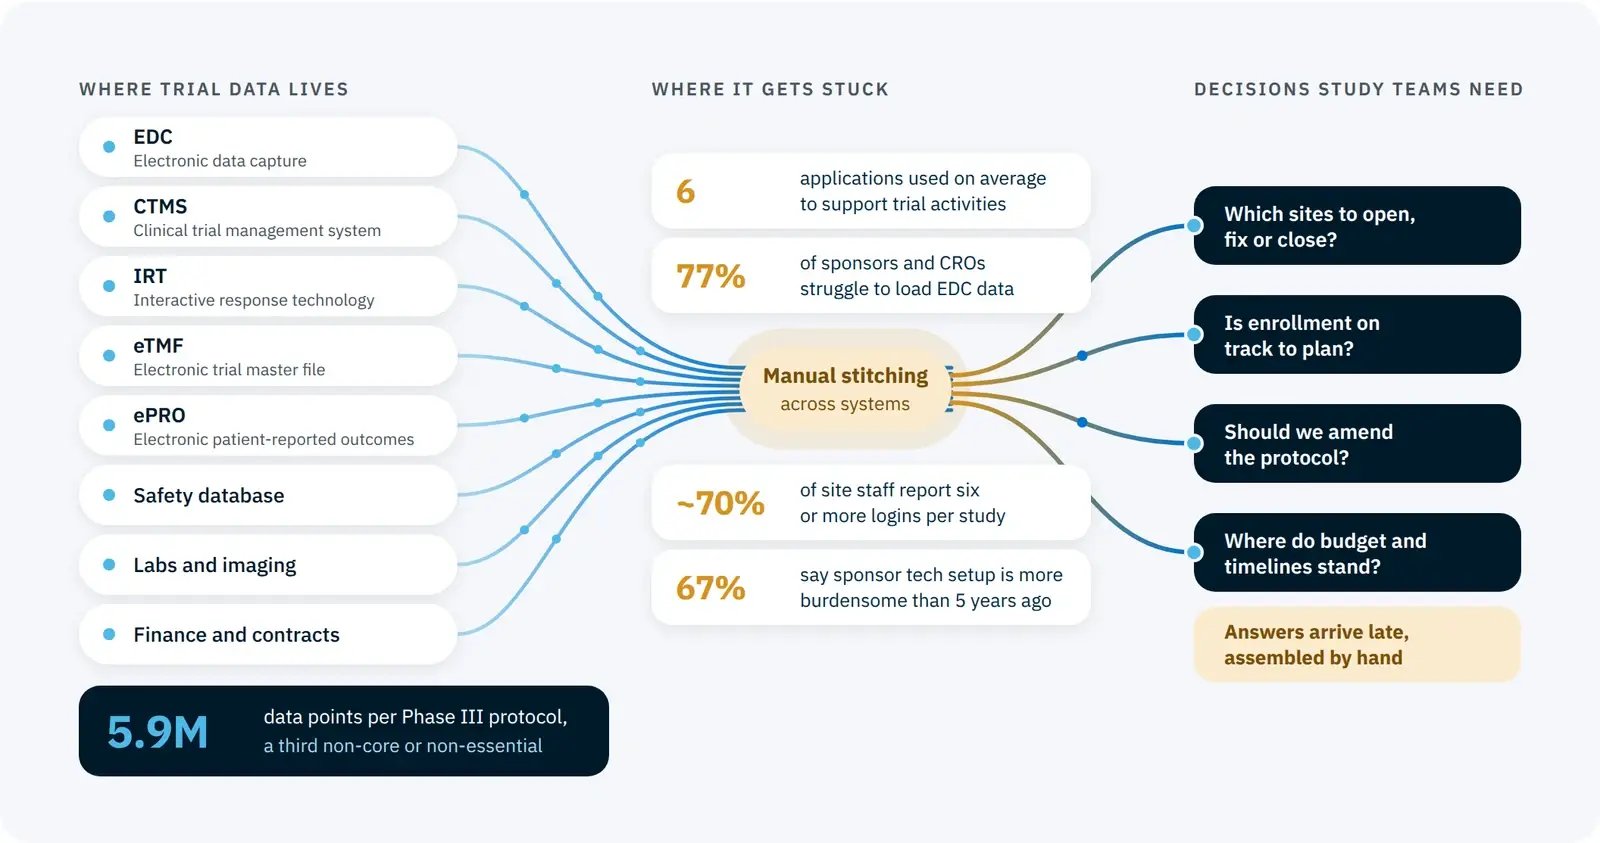
Exhibit 1: Millions of data points go in, and a handful of decisions come out late
Sources: Tufts CSDD and TransCelerate (2025); Tufts CSDD eClinical survey (2018); Advarra Study Activation Survey (2023). Systems and decisions shown are typical examples.
Waiting has a price. Tufts CSDD puts the direct cost of one day of delay at $55,716 in a Phase III trial, and each day a drug reaches the market later is worth about $800,000 in lost prescription sales. Site start-up is one place those days go. In a Tufts CSDD survey, new sites took about ten weeks longer than sites the sponsor had used before to move from identification to ready to enroll.
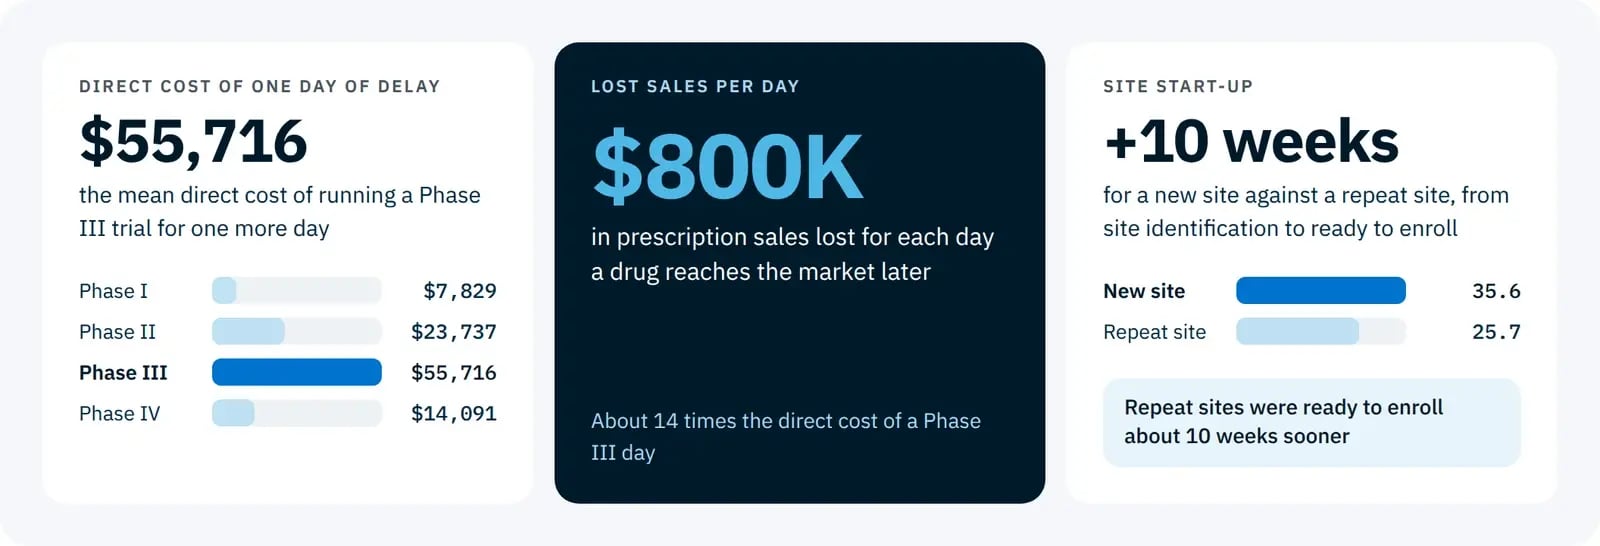
Exhibit 2: Every day of delay is expensive, and slow site start-up adds weeks
Sources: Tufts CSDD, Quantifying the Value of a Day of Delay in Drug Development (2024), mean direct cost per day by phase and lost sales per day. Tufts CSDD and goBalto, START II site selection study (2017), a survey with 591 responses.
Lynx point of view
Put decision latency on the dashboard
We call the time between a signal appearing in the data and a decision being taken on it decision latency. In the opening story it was 14 days. Tracking it next to enrollment and cycle times shows where a trial is losing days, and it is the part of the timeline AI is best placed to shorten.
WHERE AI PAYS OFF
AI pays off first where the work is repeatable
Two families of use cases are taking shape across the trial lifecycle. The efficiency family is delivering returns today.
Trial efficiency use cases follow the operational spine of a study, from portfolio view to submission. Trial intelligence use cases sit at its scientific decision points: which indication to pursue, what dose and schedule to start with, and what the trial data is showing. A shared decision layer gives study teams one front door to all of them.
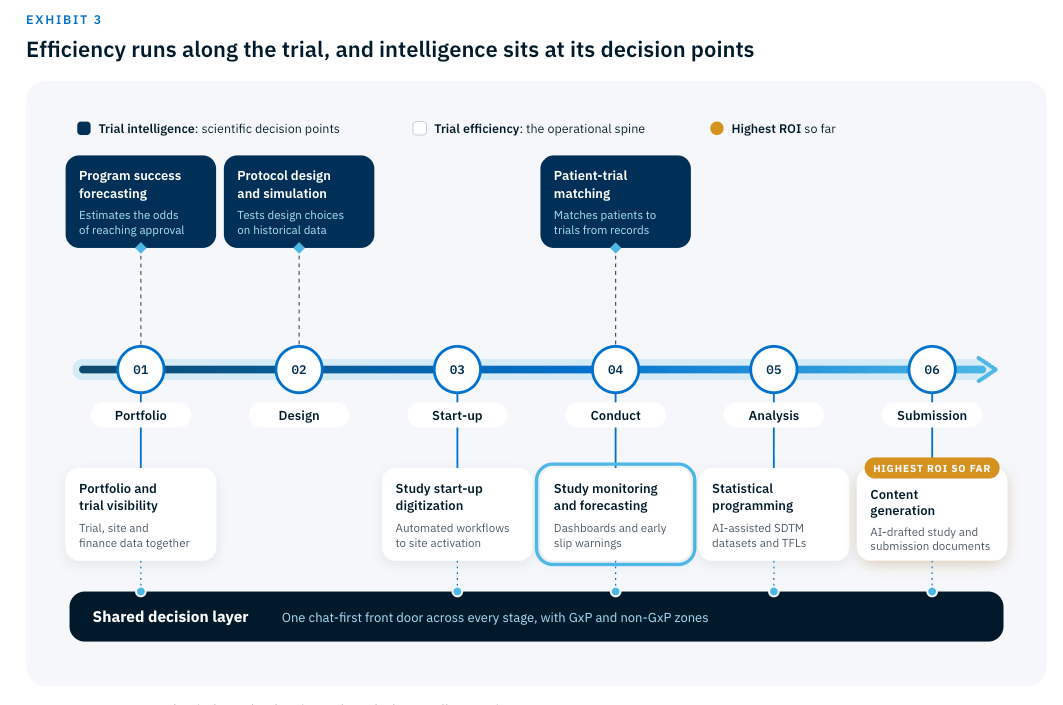 Exhibit 3: Efficiency runs along the trial, and intelligence sits at its decision points
Use case types observed across the industry. ROI marker reflects what Lynx Analytics has observed in the work delivered across multiple teams.
In the spotlight: Study monitoring and forecasting · Content generation
Along the efficiency lane, portfolio and trial visibility brings trial, site and finance data together, so leaders see every study in one place. Study start-up digitization automates the workflow that takes a site to activation. Study monitoring and forecasting gives early warning when enrollment or milestones start to slip. Statistical programming assists with submission datasets and the tables, figures and listings built from them, and content generation drafts study and submission documents for experts to review.
The intelligence use cases are fewer and more specialized. Indication prioritization ranks candidate indications on real-world data. First-in-human dose and schedule work projects a starting dose and optimizes the schedule. Therapy-area clinical insights support the analyses that clinical teams run on trial data. Each depends on specialist data and scientific judgment, which is why they tend to follow the efficiency use cases.
The returns are already visible
The strongest evidence so far comes from the efficiency lane.
DOCUMENTS
180 to 80 hours
on average to create a fully human-reviewed first draft of a clinical study report at MSD, with drafting time down from 2 to 3 weeks to 3 to 4 days.
MSD company release, 2025
SCREENING
42.6%
less screening time with TrialGPT, built by NIH researchers to match patients to trials, in a pilot user study.
Jin et al., Nature Communications, 2024
TIMELINES
72.9%
of respondents with more than 18 months of AI experience report shorter clinical trial timelines.
Medidata and Everest Group, 2026
In our work delivered across multiple teams, content generation has delivered the highest ROI so far. Clinical study reports, protocols and submission sections are long, repeatable and produced in volume. AI takes the first draft, experts keep the final say, and the hours saved are easy to count. The wider market shows the same pattern. In a 2026 Everest Group survey for Medidata, 86.5% report improvements in high-volume, rules-based workflows, and 82% of respondents expect a two to three times return on investment.
Lynx point of view
Efficiency funds intelligence
The use cases that pay back first also lay the groundwork. Content generation and trial visibility earn budget and trust. Their pipelines, access rights and review habits then carry forecasting and the scientific use cases, which need specialist data and teams.
The next two sections put two of these use cases in the spotlight and show how to do each one well.
By the numbers
The case in four numbers
5.9M
data points collected in an average Phase III protocol
Tufts CSDD and TransCelerate · 2025
$55.7K
direct cost of a single day of delay in a Phase III trial
Tufts CSDD · 2024
92%
of pharma, biotech and CRO leaders plan to increase AI spend
Medidata and Everest Group · 2026
82%
of the same leaders expect a 2 to 3x return on that investment
Medidata and Everest Group · 2026
SPOTLIGHT: STUDY MONITORING
Answer "are we on track?" in the meeting where it is asked
Study monitoring and forecasting brings trial, site and finance data into one view, forecasts where the trial is heading and lets the team test a fix before committing to it.
In the opening story, the answer took 14 days of exports and spreadsheets. With the data connected, the same question is answered in the meeting, with the six stalled sites on the same screen.
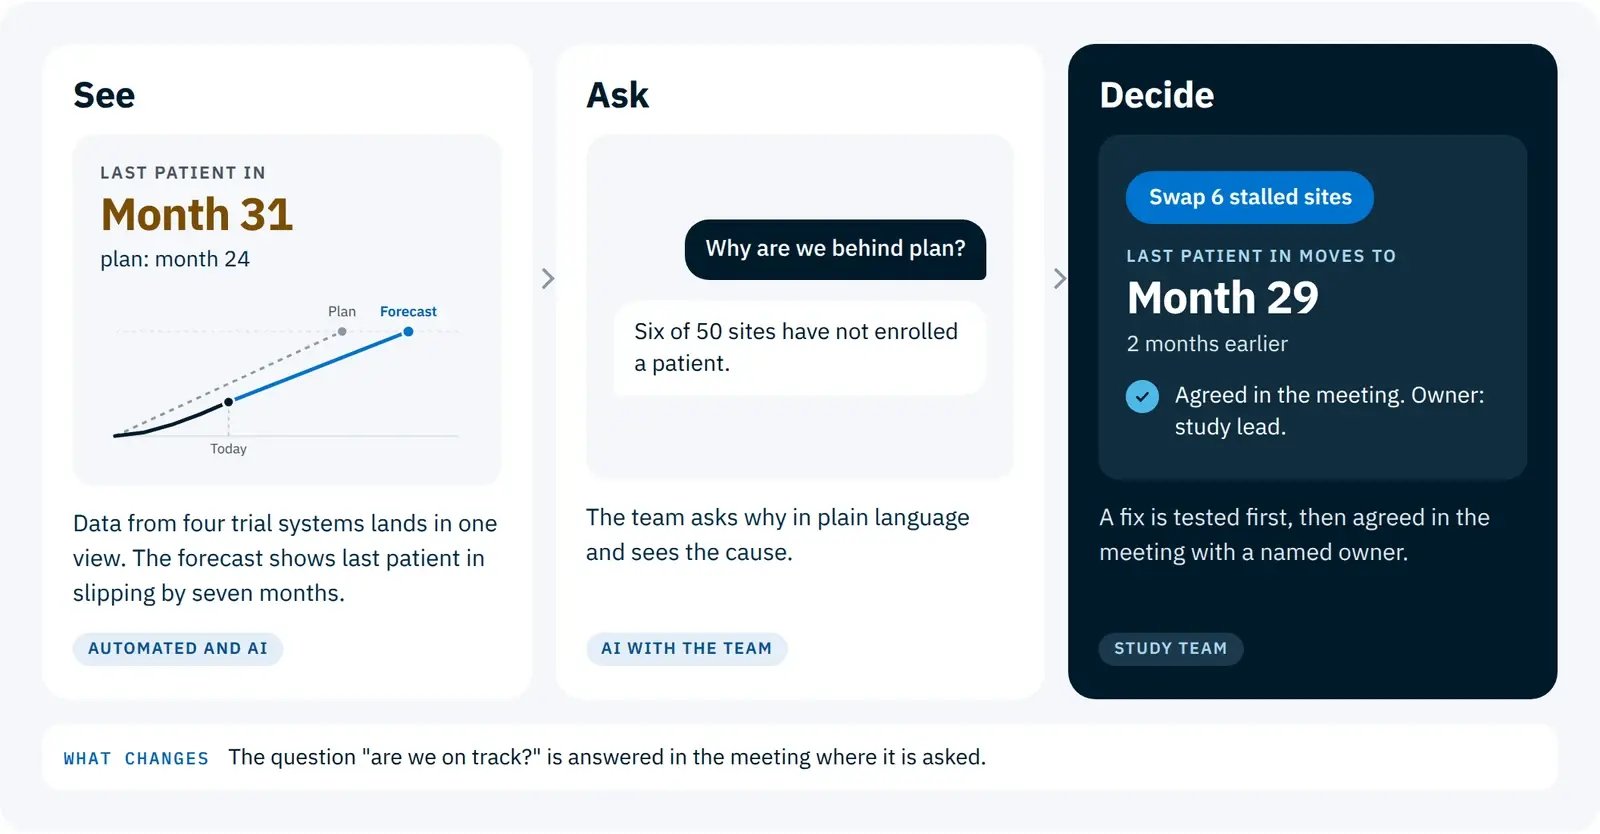
Exhibit 4: Study monitoring: see the slip, ask why, decide the fix
Illustrative screens based on patterns Lynx Analytics sees across sponsors. All trial data shown is invented for the example. The tested fix assumes replacement sites enroll at the average rate of active sites from month 15.
How to do it well
Begin with one question. It is tempting to connect every system before showing anything. A better starting point is a question the study team already asks every week, such as whether last patient in is on track. That question decides which feeds come first: enrollment from the trial management system, screening from data capture and randomization from IRT. A first release built around it stays small, and the team has a reason to open it every Monday.
Forecast at site level. A trial-level average hides the sites that drive a slip. Giving each site its own enrollment rate shows where the delay sits. Splitting screening, screen failures and enrollment against plan then shows why. A trial that struggles to find patients needs a different fix from one that struggles to open sites.
Design it around the meeting. The weekly study team meeting is where the view earns its place. The team should be able to see the forecast, ask why, test a fix and leave with a decision and an owner. Three measures show whether that is happening: the days between a signal and the decision it calls for, the forecast error on last patient in, and the number of sites still at zero enrollment.
Our view. A dashboard alone changes little. The value shows up when the weekly meeting ends with a decision and an owner, so design the use case around that meeting.
SPOTLIGHT: CONTENT GENERATION
A first draft in days, with experts in charge
Clinical study reports, protocols and submission sections are long, repeatable and produced in volume. AI takes the first draft from approved sources, and medical writers and statisticians review and approve it.
The work suits AI because the sources are fixed and every statement can be traced back to them. That traceability is also what lets experts review quickly.
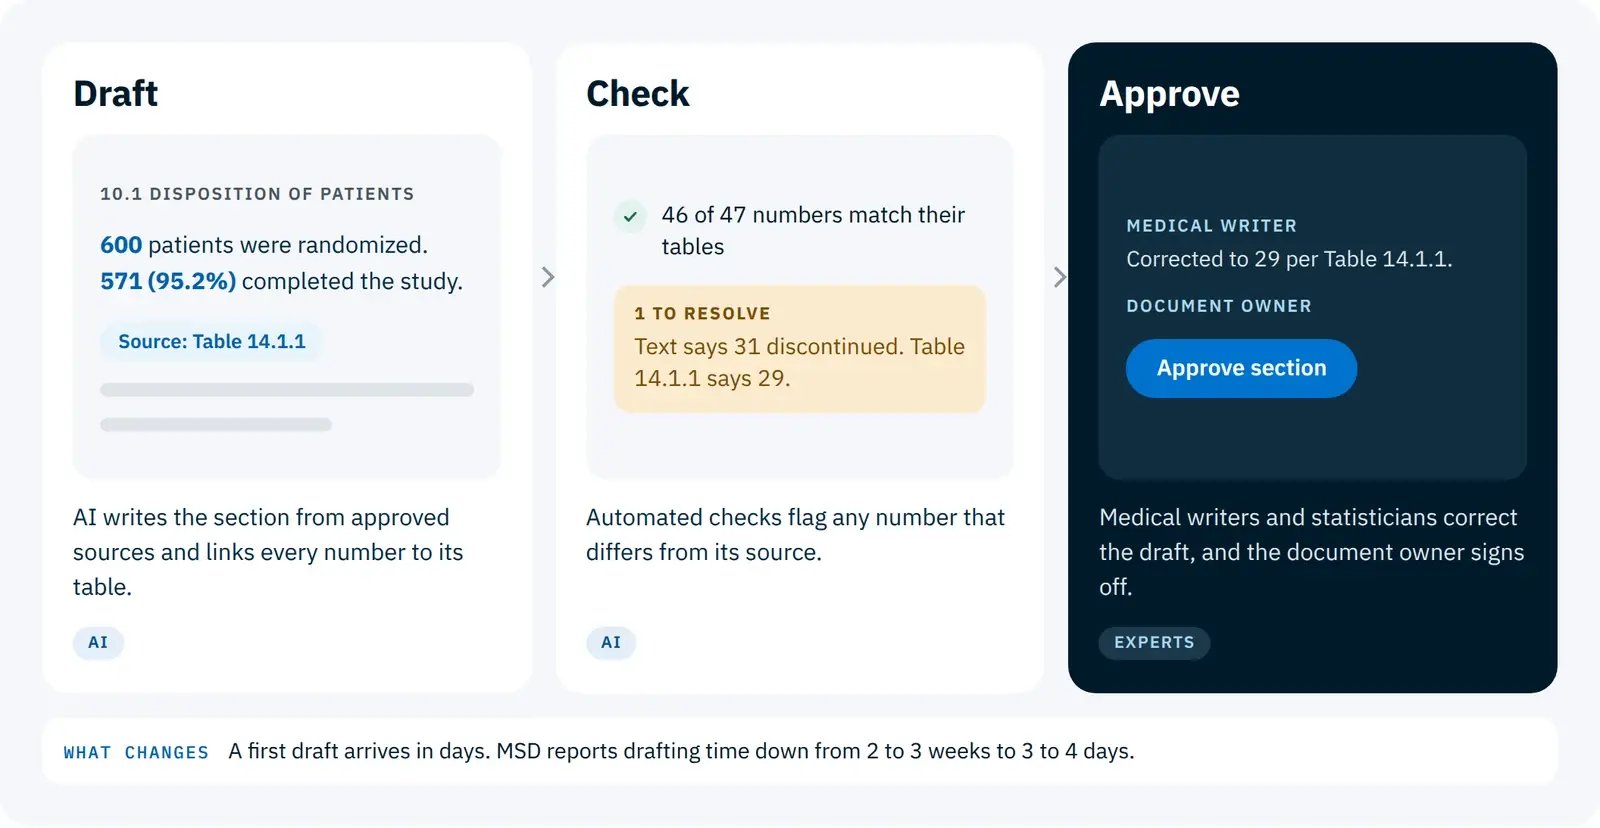
Exhibit 5: Content generation: AI drafts and checks, experts approve
Illustrative screens based on patterns Lynx Analytics sees across sponsors. All document data shown is invented for the example. Drafting times: MSD company release (2025).
How to do it well
Choose one document type. Content generation suits documents that are long, repeatable and produced in volume. The clinical study report is a natural first choice. It follows a standard outline, and its numbers come from results tables that already exist.
Fix the sources and keep every number traceable. The draft should draw only on approved material: the protocol, the analysis plan, the results tables and the template. Linking each number to its table lets automated checks compare the text with the source before a person reads it, so reviewers start from a clean draft and can confirm any figure where it came from.
Keep experts as approvers. Medical writers and statisticians review, correct and sign off, and their edits feed back into the templates and prompts. Three measures show whether the cycle is improving: the hours to a reviewed first draft, the number of review cycles per document and the corrections per draft.
Our view. Speed comes from the draft, and trust comes from traceability. A reviewer who can check every number at its source approves with more confidence.
CONCLUSION
Faster trials start with faster decisions
Trials already hold the data they need. The time goes into assembling it, and that repeatable assembly work is where AI is paying off first.
The cost of waiting is easy to state. Each day of delay carries a direct cost of $55,716 in a Phase III trial, and the days lost between a signal and the decision it calls for are days a study team can win back. Measuring that wait comes first, because it shows where a trial is losing time.
AI is paying off first where the work repeats. Content generation has delivered the highest ROI so far, and study monitoring shortens decisions inside a live trial. In both, AI gathers, flags and drafts, and study teams and experts review and decide. That division of labour keeps accountability with the people who own the trial.
Questions for your next study team meeting
- How long does it take us to learn whether we are on track for last patient in?
- Which of our documents are long, repeatable and produced in volume?
- When the data shows a site slipping, who decides what happens next, and how soon?
If the answers are slow or unclear, the cause usually sits around the model, in silos, GxP expectations and data access. A follow-up paper will take those up.
About Lynx Analytics
Lynx is an AI-native consulting firm for pharma and life sciences. We help clinical development teams connect trial, site and financial data, build the decision layer on top, and set up the governance that takes use cases from charter to adoption.
Terms used in this paper
- Sponsor: The company developing the medicine. It funds the trial and is responsible for it.
- CRO: Contract research organization. Runs trial activities on behalf of a sponsor.
- Site: A hospital or clinic where patients are seen and trial data is collected.
- Last patient in: The date the final participant is enrolled in a trial.
- CTMS: Clinical trial management system. Tracks sites, enrollment and study milestones.
- EDC: Electronic data capture. The system sites use to enter patient data.
- IRT: Interactive response technology. Randomizes patients and manages drug supply to sites.
- eTMF: Electronic trial master file. The official archive of a trial's essential documents.
- ePRO: Electronic patient-reported outcomes. Symptoms and quality-of-life data that patients enter on a device.
- CSR: Clinical study report. The full account of a trial's methods and results, written for regulators.
- SDTM and TFLs: The standard data format for submissions, and the tables, figures and listings built from it.
Sources
- BIO, Informa Pharma Intelligence and QLS Advisors. Clinical Development Success Rates and Contributing Factors 2011-2020. February 2021.
- Norstella. Why Are Clinical Development Success Rates Falling? Citeline phase transition data, 2014 to 2023. May 2024.
- Smith Z, DiMasi J, Getz K. Quantifying the Value of a Day of Delay in Drug Development. Tufts CSDD white paper, 2024.
- Tufts CSDD and goBalto. Tufts CSDD-goBalto Site Selection Market Research (START II), final report. June 2017.
- Getz K, Botto E, Arques AC, et al. Insights Informing Strategies for Optimizing the Collection of Clinical Trial Data. Therapeutic Innovation and Regulatory Science, 2025.
- Jin Q, et al. Matching patients to clinical trials with large language models. Nature Communications 15:9074, November 2024.
- MSD. MSD Expands Innovative Internal Generative AI Solutions Helping to Deliver Medicines to Patients Faster. Company news release, June 2025.
- Medidata. The State of AI in Clinical Trials, second annual report, conducted by Everest Group (survey of 200 senior decision makers at pharma, biotech and CRO organizations). News release, May 2026.
- Medidata. The State of AI in Clinical Trials, second edition, report page. 2026.
- Tufts CSDD. eClinical Data Volume and Diversity Pose Increasing Challenges and Delays. News release on a survey of 257 drug developers, published by Clinical Leader, January 2018.
- Advarra. New Clinical Trial Industry Survey Reveals Increased Burdens on Sites (2023 Study Activation Survey of more than 500 North American research professionals). October 2023.
- FDA. FDA Announces Major Steps to Implement Real-Time Clinical Trials. News release, April 28, 2026.
- Department of Health and Social Care. Commercial clinical trials in the UK: the Lord O'Shaughnessy review, final report. May 2023.
This paper draws on the published research listed above and on patterns Lynx Analytics sees across clinical development programs, including observations on ROI to date. The opening story and the screens in Exhibits 4 and 5 are illustrative and do not use real trial data.
© 2026 Lynx Analytics. All rights reserved.