

Relevant, accurate and up-to-date data – which remains consistent and accessible between multiple sites – is crucial to optimising the commercial operations of pharmaceutical companies. For business managers in particular, this is a key success factor when it comes to business monitoring and making profit-optimising calls.
But while an increasing number of life sciences companies are recognising the importance of data and are investing in central data warehouses, much of this data is often inaccessible to business managers.
Why is this so? The primary reason is that accessing live data from data warehouses requires expert knowledge to interrogate databases and create reports that can be easily read by those across the organisation. This is something that the average business manager usually doesn’t possess. Furthermore, data volumes are often too big to be downloaded and manipulated in an Excel file.
As a result, many business managers still rely on a combination of PowerPoint presentations and Excel reports provided by controlling or other support functions. The creation of such reports is not only labour intensive, it’s also time consuming – which slows down overall commercial decision-making activity. Additionally, this means that the data reaches business managers with a certain time lag.
To add to that, data files and reports in spreadsheets such as Excel often lead to version conflicts, inconsistent figures and potential governance and security challenges, as files can be forwarded, stored and shared without systematic checks and balances.
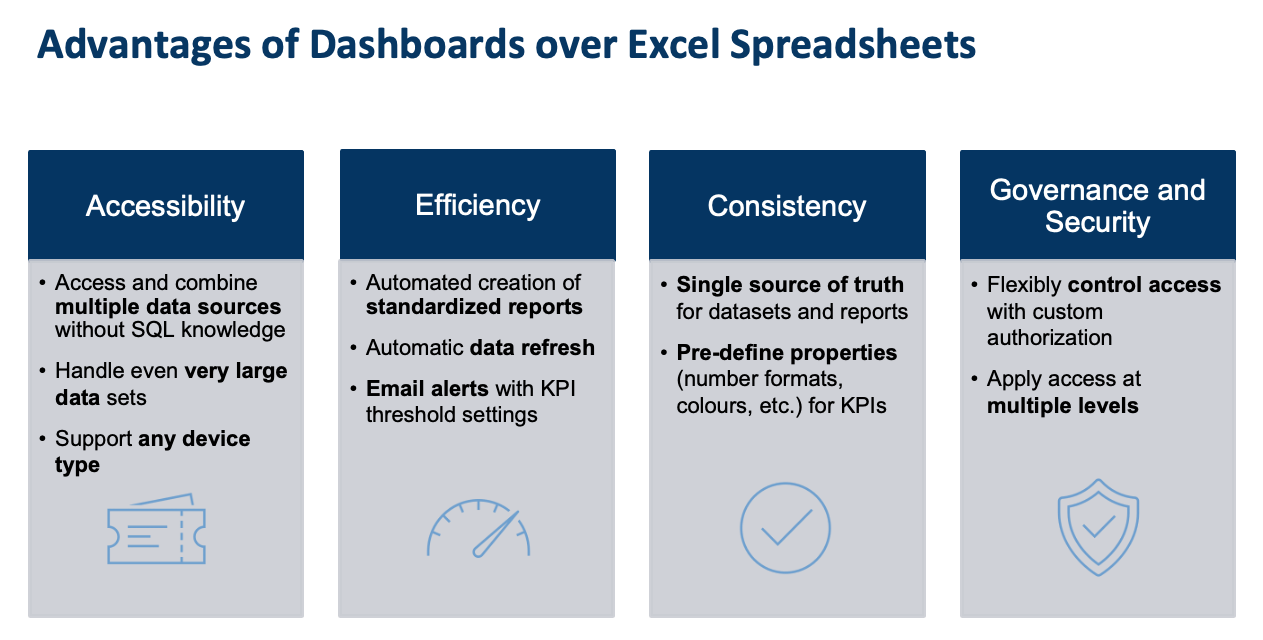
Given these challenges, dashboards – if properly executed – can add substantial value to business managers and decision makers throughout a company. These dashboards are usually based on technologies such as Tableau, Power BI or Spotfire, and offer a myriad of advantages to help drive effective, data-driven decision making, as illustrated in the table below:
To equip companies with these benefits, Lynx Analytics has partnered with numerous clients to help them build out effective data dashboards.
Take a recent project, where Lynx Analytics supported a global pharmaceutical organisation in establishing a cross-country Sales Force Effectiveness (SFE) dashboard for Asia and Australia. The dashboard allowed business managers to evaluate sales force activities on a daily basis; evaluate target achievement across offline and online channels; and monitor sales.
Besides empowering business managers to plan their activities more effectively through a dedicated healthcare provider (HCP) view, the dashboard also gave regional managers the ability to compare KPIs across disparate countries.
To successfully construct the data backbone and create the dashboard, Lynx Analytics set up several workstreams across different phases of the project and worked closely with various local and regional stakeholders.
Key activities included:
- Onboarding all required data into the client’s global data lake
- Working with global stakeholders to ensure alignment on how KPIs are calculated
- Creating the Tableau dashboards within the client’s data environment
- Conducting thorough data validation and rigorous user acceptance testing
- Coordinating cross-functional and cross-country project teams consisting of the client’s internal IT experts and data engineering staff
Lynx Analytics was able to quickly establish the dashboard, which has been successfully implemented by the company’s local business stakeholders across Asia and Australia to make data-driven commercial decisions.
Beyond this particular case, Lynx Analytics has worked with other clients to create dashboards that track and display the results of awareness, trial and usage studies over time; as well as those that summarise HCP-related information including recent publications, conference participations and online activities.
Indeed, be it gaining a more holistic understanding of HCP behaviour or better monitoring cross-country sales force activities, well-executed dashboards can equip business managers with the necessary tools to enact revenue-optimising decisions.
This is the third in a three-part series of articles on best practices for sales and marketing analytics in the pharmaceutical sector.