

Many real world use cases involve data that can be naturally represented as a graph. As such, the ability to train a machine learning model on graph structures can be advantageous over methods that do not take into account the underlying structure of connections between model entities.
Graph neural networks methods have been specifically developed to train a neural network on graph structure. In this article we will show an example of graph neural networks to predict patient outcomes using LynxKite.
LynxKite is an open source graph data science platform that enables one to perform sophisticated graph analytics and graph ML operations using a simple point-and-click interface.
We have used the eICU Collaborative Research Database, which contains an anonymized information about 315,460 patients (454,324 admissions) with ICD 9/10 diagnosis codes for all patients and admissions.
The dataset contained 28.2M Electronic Medical Administration Records (EMAR) and 6.7M Online Medical Registry (OMR) records, as well as treatment and medicine information with dosages.
The schema of the dataset is quite complex, and itself can be visualized as a graph in the Figure below:

Our goal would be to predict the future length of stay in ICU and future probability of death using patient medical information of the first record. The methodology we followed was the following:
- Based on common diagnoses, demography and other medical records (such as BMI, blood pressure), build a patient-patient similarity graph
- Identify highly similar patient groups using modular clustering
- Train Graph Convolutional Network (GCN) on 80% randomly sampled patients, and evaluate the results using the remaining 20% of patients
The overall LynxKite workflow is shown on the Figure below:
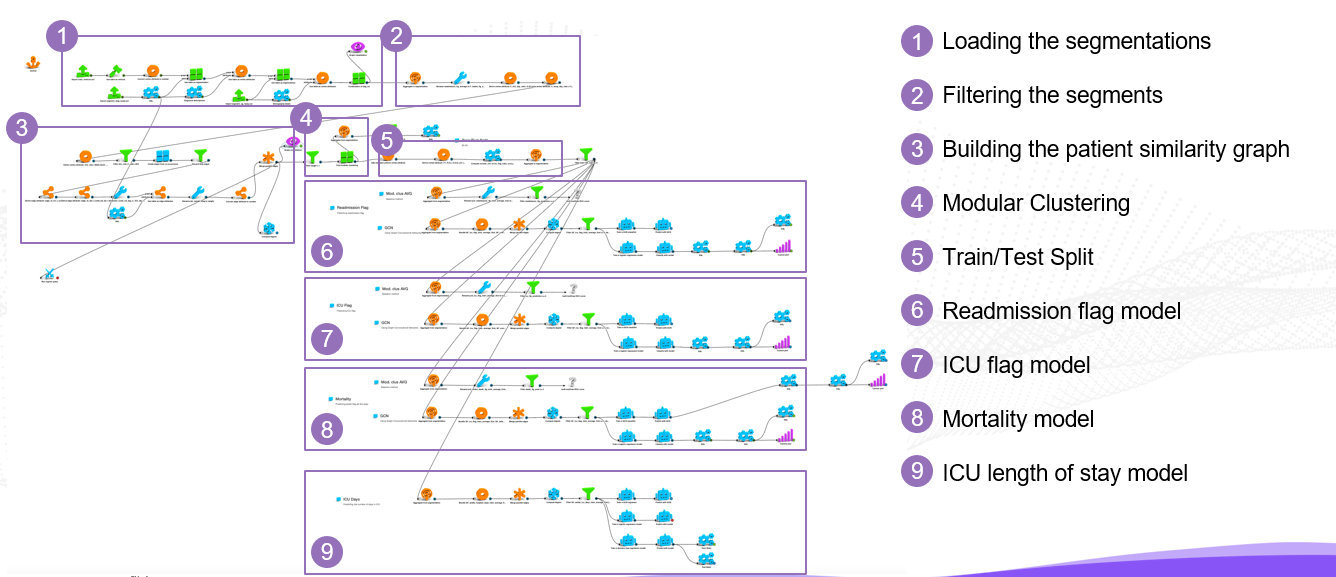
First, we have loaded ~190,000 patients as vertices, with diagnoses, other medical information and demographic profile as segmentation. We have used only common diagnoses, those that have at least 10 patients to simplify the analysis.
Segments that were too small or too large were filtered out. Also, we filtered out segments that show large variations in hospital days. As a result, we have obtained approximately 64,000 segments.
Afterwards, we have created edges from co-occurrence (meaning for every two patients belonging to the same segment an edge will be created between those two patients), as shown on the Figure below:
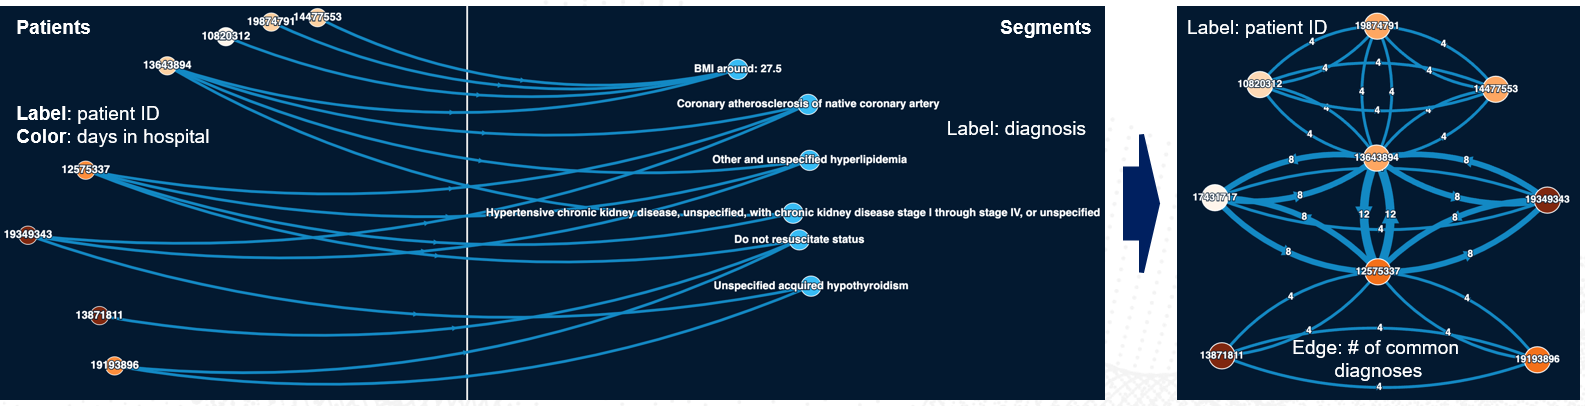
A part of a patient similarity graph is shown below. Two large highly interconnected subgraphs can be seen on a picture, with some connections in between.
This indicates two patients from the same subgraphs are more similar to each other (potentially belong to the same segment, or even multiple segments) vs two patients from different subgraphs.

We set edge weights being proportional to the inverse of segment frequency. After merging parallel edges while summing up edge weights, we have identified groups of similar patients by performing weighted modular clustering.
Afterwards, we have trained a Graph Convolutional network to predict probability of death and length of ICU stay using average within cluster respective outcome values for patients from training sample.
The resulting performance metrics on testing set were as follows:
- Death flag: Area Under the Curve (AUC) is 0.862;
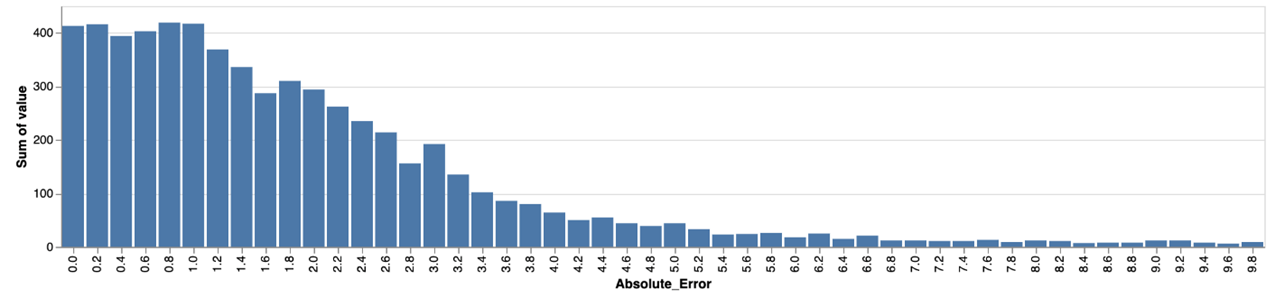
- ICU days: Mean Absolute Error (MAE) was 2.8 days, while Mean Absolute Percentage Error was 0.68. The error distribution is shown on the Figure below
To summarize, we have built a graph convolutional neural network model to predict future probability of death and length of ICU stay using LynxKite.
As can be seen, with LynxKite it is relatively easy to develop and run machine learning on graphs due to its simple point-and-click interface and intuitive flow design, especially for people who do not have deep experience in applying open source machine learning algorithms in languages like Python or R.
In general, predicting patient outcomes, like death and ICU stay, can be very useful for a healthcare facility operator, for example, for planning of staffing and resource allocation.
Given limited availability of ICU beds, accurately predicting a number of available beds in a future might be crucial not to run out of available capacity.