
Executive Summary
A global life sciences company partnered with Lynx Analytics to transform how it monitors compliance risk across thousands of sales engagements with healthcare professionals (HCPs).
The client’s legacy model could detect anomalies but offered little insight into why an interaction was deemed risky. Lynx implemented a supervised machine learning solution that combined explainable AI, extensive feature engineering across multi-sourced transactional data, and intuitive visualization.
The result: compliance officers now understand the drivers behind every flagged claim, enabling faster, smarter, and more defensible decisions.
Context
The client’s sales representatives routinely host meetings, events, and meals with HCPs — activities that must adhere to strict corporate and regulatory policies. These guidelines dictate how often representatives may meet HCPs, how much they can spend, and where such engagements can occur.
To monitor policy adherence, the client relied on an unsupervised machine learning model that analyzed expense claims filed through SAP Concur. While the system could flag irregularities, it provided no explanation for why a particular engagement was risky. This lack of transparency made it difficult for compliance officers to justify and prioritize investigations or trust the model’s outputs.
The client wanted a more intelligent, explainable solution that could detect subtle behavioral risk patterns — even in cases where surface-level rules were technically followed.
Challenge
Despite having an existing monitoring system, the client faced several persistent challenges:
Ultimately, the client’s goal was not cost reduction but compliance integrity — ensuring global adherence to both internal and external standards through a defensible, data-driven approach.
Solution
Lynx Analytics developed a supervised machine learning solution designed for precision, transparency, and scalability.
Building an Explainable Model
The project began by defining over 400 features inspired by Key Risk Indicators (KRIs) from the client’s internal policy and compliance manuals. These features captured both direct data points — such as claim amounts, attendee counts, and engagement frequency — and derived behavioral indicators that offered deeper insight into patterns of activity.
For example, a derived feature — the “no-show ratio” — flagged engagements where most invitees failed to attend but the full budget was claimed, signaling potential non-compliance.
All data was sourced directly from SAP Concur, ensuring clean, consistent inputs for modeling.
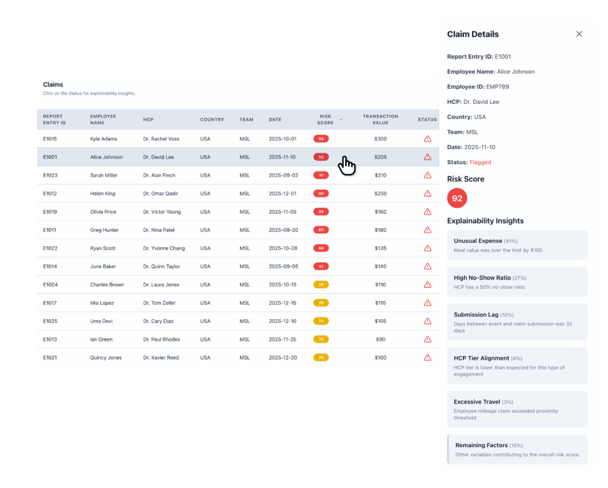
Interactive Dashboard
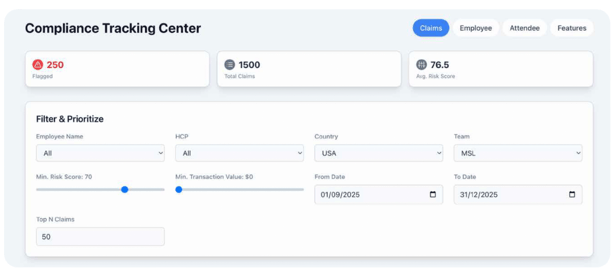
An intuitive dashboard was built for approximately 50–80 compliance monitoring officers worldwide.
The interface provided:
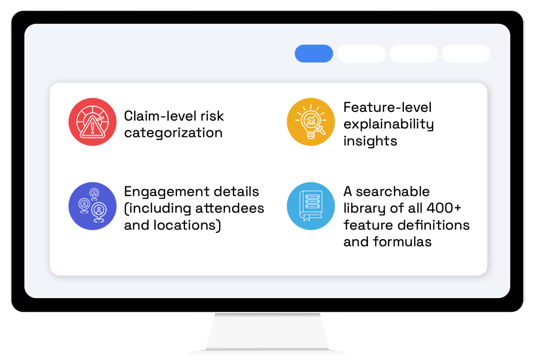
The dashboard enabled officers to focus investigations on the most relevant cases and document findings for audit purposes.
Risk Scoring and Explainability
The supervised model evaluated each engagement and generated a probabilistic compliance-risk score. This score represents the model’s assessment, on a scale from 0 to 100, of how likely a claim within that engagement is to fall outside company guidelines or regulatory constraints.
The probability score is derived from the model’s ability to recognize patterns associated with non-compliant behaviors. This capability was developed during the supervised training phase, where the ML model learned to differentiate between compliant and potentially problematic content.
Risk Score Interpretation:
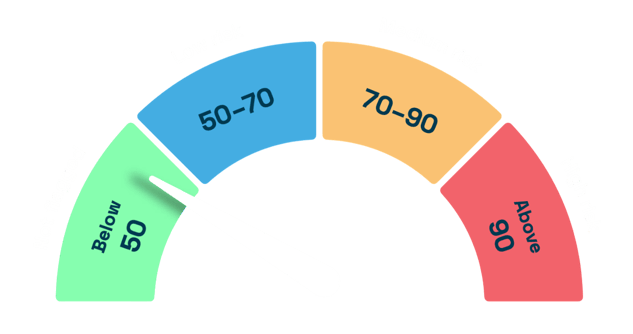
For every claim, the system identified the top five features contributing to its risk score, along with their relative percentage influence. This explainability addressed one of the client’s most pressing needs — helping compliance officers understand why a claim was flagged.
Localized Compliance Awareness
The solution was designed to accommodate regional regulatory differences, ensuring that risk assessments reflected the specific rules governing each market. For example, while the client’s global policy might allow a $35 breakfast, certain U.S. states impose stricter spending caps or even prohibit certain types of engagements altogether. These jurisdictional nuances were seamlessly integrated into the system’s logic so that engagements were always evaluated within the correct local context.
During user acceptance testing, an additional geographical nuance emerged. Compliance officers noted that some risk indicators behaved differently across the U.S. and markets outside the U.S. (OUS). One feature in particular — “Multiple Currencies Used in Last Month” — was a meaningful signal in the U.S., where unexpected switches between currencies could indicate irregular or non-compliant activity. However, this same feature was not relevant in many OUS markets, where sales representatives routinely work across borders and naturally operate in multiple currencies.
To address this difference, Lynx Analytics split the training dataset into U.S. and OUS subsets and developed two parallel models, each with a tailored feature set. This design allowed region-specific indicators to be activated or deactivated depending on their relevance, giving the client customizable, explainable, and locally aligned risk models without compromising global consistency.
Implementation
The solution was delivered in just five months, including model development, user testing, and deployment. A focused team of two data scientists and one visualization engineer executed the project. Thanks to the client’s mature data infrastructure, minimal data engineering was required, allowing the project to move rapidly from concept to value.
Impact and Results
The new system transformed the client’s approach to compliance monitoring. Instead of relying on opaque statistical alerts, compliance officers now benefit from clear, contextual insights that explain each flagged case. Investigations have become faster and more effective, as officers can prioritize high-probability risks and immediately understand the rationale behind every score.
This shift has built trust in the system, encouraged adoption, and improved cross-regional consistency in compliance monitoring.
By transitioning from an unsupervised to an explainable supervised model, the client achieved a step-change in transparency, accountability, and operational efficiency.
Although the project was not designed to save money, it has delivered substantial value by reducing reputational risk and strengthening the organization’s compliance culture.
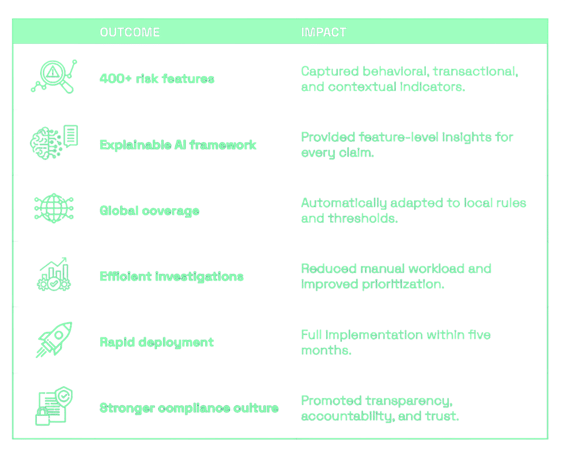
Key Results
Conclusion
Through its collaboration with Lynx Analytics, the client transformed its compliance monitoring from a static, opaque process into a dynamic, explainable, and data-driven system.
By combining advanced machine learning with human-centered transparency, the organization now operates with a higher degree of ethical assurance and regulatory confidence.
The project demonstrates how explainable AI can elevate compliance from a reactive function to a strategic pillar of corporate integrity — ensuring that oversight is not only automated but also understood.

Other Recommended Reads in Pharma
CRM x Generative AI The next level of customer engagement for pharma
Imagine a world where your CRM doesn’t just passively store information but actively helps you make smarter decisions—telling you who to see next, what message to deliver, and which product aspects to emphasize. Instead of viewing your CRM as a time-consuming chore, what if it became your most valuable asset in navigating complex customer interactions and maximizing sales effectiveness?

$60M Reallocated. $100M Revenue Uplift. The AI that’s Changing Pharma Marketing
Learn how Lynx Analytics developed a custom AI-powered decision support system designed to give the client’s marketing team full visibility into their promotional spend, impact on sales, and ROI. The solution combines advanced statistical methods and AI-driven modeling to analyze vast amounts of data from multiple sources, including sales figures, promotional investments, CRM entries, competitor activity, macroeconomic trends, and digital engagement metrics.
