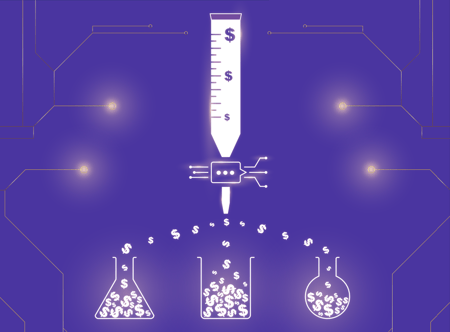
Druid is an open-source, high-performance analytics database. We use it at Lynx Analytics to power client-facing dashboards. This article focuses on the features of Druid that we rely on and our experience with it.
Interactive Dashboards
We take on a great variety of projects at Lynx. But always the goal is to produce useful data science results. The data science results are a big pile of numbers at first. We need to present them on beautiful dashboards before they can be useful.
From a database point of view, we can see that we have some trend lines on the first page. More importantly, we display distributions at the bottom of the second page. We have the distribution by age, gender, subscription type, and so on.
It is not enough for this dashboard to be pretty. To support many different business uses, the dashboard also needs to be interactive. We want to click around on those distribution charts to filter down to a customer segment. We may select 25–54 year old males with a “blue” subscription. As we make this selection, all the charts need to be updated to show the data specific to the customers who match the selection.
This is a very natural way to explore your data. Yet, we don’t see this kind of dashboard very often for large datasets. That is because, with the usual database technologies this is surprisingly hard to implement.
If we used a relational database, we would need to build indexes for all filter combinations. Even if we limited the user to three simultaneous filters and had only ten different filters total, we would need a thousand indexes.
Our dashboard has around 100 different filters, and they can be freely combined! (Most of them take an extra click to access so that the user interface does not become overwhelming. However, for the database, they are the same as the age and subscription type filters.)
Another idea is to precompute the aggregated statistics for all potential filter combinations. This also suffers from this exponential (in the number of simultaneous filters) and high-order polynomial (in the number of available filters) problem.
The only way to fix the scaling is to process the full dataset on the fly for each query. We use Apache Spark for most of our large-scale data science work, and it’s great. It’s fast. However, it’s not fast enough to create histograms of a dozen attributes for millions of customers in a fraction of a second.
Enter Druid
[A scalable Druid logo is at https://landscape.cncf.io/logos/druid.svg.]
Druid is exactly what we need: a high-performance OLAP database. The Druid website explains in detail what that means. The short of it is that we load each day’s data into it in a batch, and then that data is immutable. We cannot update a record. In exchange, aggregate queries with filters are blazing fast.
Druid has a SQL interface, but it’s an afterthought. It’s great for debugging. It maps to Druid’s native JSON-formatted query language. But the mapping is not one-to-one. SQL has some features that are not supported in Druid. Druid has some features that are not supported in SQL. Most importantly, a single Druid query can answer many questions at the same time. The complex dashboards that you saw make a single Druid query to populate all the plots!
Druid is written in Java and fits in well with the Hadoop ecosystem. It is very efficient. We get away with running it on a single powerful node. However, it is designed as a distributed system, so we can quickly scale to a cluster deployment when needed.
It is fast, scalable, has a quirky but fairly simple interface, and solves a very real big data problem. You would expect that a lot of big companies would be enthusiastic about Druid. And they are!
Here are just a few notable names from the Powered by Druid page:
A very quick summary of how Druid works
During ingestion, an immutable, partitioned segment file is created for the day’s data. (If you are working with daily granularity.) We have to specify which column is the timestamp, which columns are dimensions and which columns are metrics.
- Dimensions are things we want to filter and group by.
- Metrics are things we want to average and sum.
Rows with identical dimensions are pre-aggregated in the procedure called “roll-up”. For each metric we specify how it should be aggregated. This has a bearing on what queries we can later execute. For example, if we have “sum” and “min” aggregation for a metric, we can query “sum” and “min” and “avg” (since it’s computed from “sum”). However, a query for “max” would fail. The maximal entry is impossible to recover from the pre-aggregated data.
Each column is stored separately. So whether we have 5 columns or 500 would make no difference if we run a query involving 5 columns.
Dimensions are stored as compressed bitmaps. This means that when we filter for “gender=male, subscription=blue”, Druid knows which records those are and never has to look at records that do not match. It has the surprising effect that queries with complex filters are faster than unfiltered queries. The complex query has to touch fewer records!
Our Druid journey
As we set out to implement this dashboard in 2017, we quickly decided that Druid was a perfect fit. We also decided that Tableau was a perfect fit. With a few clicks, you can build a beautiful dashboard. Embed it in a stylish web page, and we’re done!
Tableau cannot directly connect to Druid, but we found a detailed three-part tutorial from Hortonworks that explains how we can set up the connection through Hive.
However, during the project, we discovered a few issues.
- Tableau is Windows-only. You cannot just SCP a file to a Windows machine in production. Deploying new dashboard files or changing the configuration from a different continent through a laggy VPN via Remote Desktop was depressing.
- Tableau requires 32 GB RAM and 8 CPU cores even though in this setup it’s just taking the data from Druid (through Hive) and passing it to the browser for rendering.
- Since Tableau doesn’t know anything about the database backend, it has no choice but to send a separate query for each chart. With dozens of charts, this results in dozens of queries, submitted one after the other. This completely kills performance.
- Hive can translate some queries to Druid. For other queries, it wants to fetch all the data from Druid and execute the query on its own. That would be prohibitively slow, so we didn’t even set up a Hadoop cluster. Hive notices this severe lack of computing resources after a minute’s timeout.
- Tableau generates the SQL for you. We often knew how a query would have to be phrased for Hive to be able to translate it, but the user has no control over the query.
- The JDBC connection had a tendency to expire after some hours. The first query after a day of idling took 5 minutes of multiple timeouts and retries before eventually returning an error. A simple reload then restored the dashboard to working condition.
- We went to great lengths to make this setup work anyway. The best illustration is that we patched Hive to invoke an external command to transform incoming SQL queries. We had a shell script run “sed” on all queries so that Hive could translate them to Druid queries.
It was not the perfect system we had envisioned, even if all its parts were great on their own. We quickly switched to a significantly simpler architecture where we have a hand-written HTML+JS dashboard instead of Tableau.
More than a year has passed since our experience with the Tableau+Hive+Druid setup, and many of the issues may be resolved now. However, the advantages of directly accessing Druid are overwhelming:
- Everything is Linux. Everything runs on one machine. We don’t even need to juggle license files.
- The Druid query is expressed with Plywood. (It’s a nice JavaScript API for building the JSON-format Druid query.) A single query fetches everything. It is fast.
- The Node.js backend is trivial, as it just passes the Druid result to the frontend without changes. The frontend uses Plotly.js to plot the data.
- The Druid table uses a simple, natural format. (In the previous setup we had to make some peculiar schema choices to make things work.)
- A team can collaborate on the dashboard development in GitHub. No more “Dashboard_Final_v12.twbx” attached to an email. No more manually merging changes on a GUI.
- Perfect integration with our branding and unlimited customization. We have implemented dozens of features and small tweaks that would have been impossible in Tableau.
Tips for your journey
If you are setting out to build something on Druid, I have a few practical tips for you.
CSV is fine. Druid supports Parquet and other formats via extensions. Since it supports CSV without extensions, we started with CSV. Never had any problems related to this.
Specify the number of partitions explicitly for the ingestion job. If you don’t, the indexer has to do an additional pass over the whole dataset to count the number of rows. (Perhaps this is only a concern with CSV...)
Have at least one partition per core. The historical server processes each partition on a single thread. If you have fewer partitions than cores, you will not take full advantage of your processing resources.
Follow “Tutorial: Updating existing data”, not “Updating Existing Data”. They show two different ways of ingesting new data into an existing table. The practical difference is that if you follow the second method, the indexer log files will grow to ridiculous sizes. We generated 70 GB of logs for ingesting 1 GB of data. All that logging is not great for performance either.
Druid has many different log files. When ingestion fails, look in the last indexer log in ~/logs.
Get everything with a single giant query. This is a huge advantage of Druid and invaluable for dashboard applications.
Use PlyQL for quick debugging. In verbose mode, it also shows you the JSON queries.
Opt for a wide schema: it’s better to have many columns than to have many rows.
We haven’t tried cluster mode. It’s fast enough on a single machine. We haven’t tried real-time streaming. We haven’t tried text search. We don’t use roll-up.
Each row in our table is a person with a unique ID. This results in a high-cardinality dimension, which the Druid docs recommend against. We never filter or group by this column, so it’s fine. We only use it for the bulk download of a segment, which is not as sensitive to latency as the rest of the queries.
Have fun! Druid is great. We are excited to see where it goes.